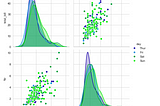
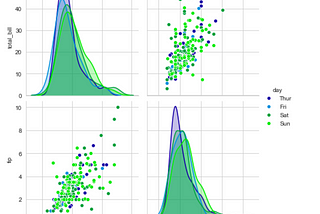
PinnedHoda SaifulPAIR PLOTS (in Python Seaborn)A pair plot is a 2D categorical scatter plot that represents the pair wise relationship between the numerical variables in a data frame.2 min read·Nov 30, 2020----
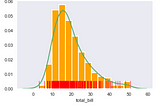
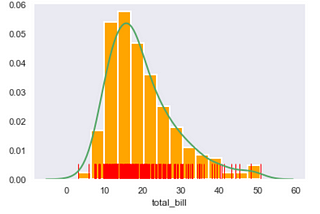
PinnedHoda SaifulDistribution (Dist.) Plots in Python (Seaborn)A distribution plot is a combination of Histogram, Kernel Density Estimate (KDE) & Rug Plot, all in one single frame !2 min read·Dec 8, 2020----
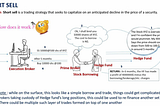
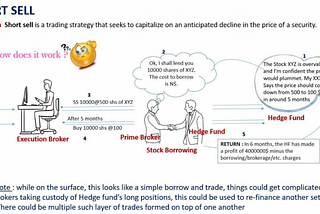
PinnedHoda SaifulShort Sell Trades -How does it work ?!For the regular definition, this link should suffice. In this post, I discuss the cycle of a short sell trade and obligation of an…2 min read·Nov 23, 2020----
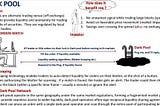
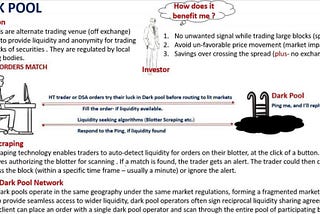
PinnedHoda SaifulDark Pool Trading — An insider viewThere has been a steep surge in the number of trades executed off the exchange. Dark Pools have been at the forefront of this trend. There…2 min read·Nov 22, 2020----
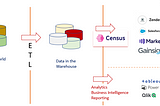
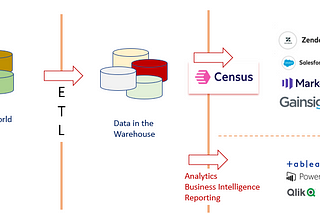
Hoda SaifulReverse ETLThe Data infrastructure within firms has evolved continuously. Processes like ETL have enabled firms transform, store and utilize…2 min read·Sep 9, 2021----
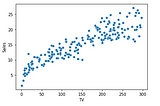
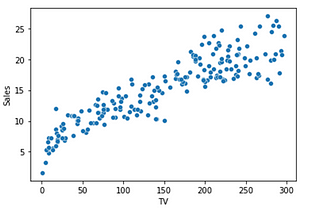
Hoda SaifulSimple Linear RegressionA linear regression model is used to predict the value of a variable based on the value of another variable. The variable you want to…3 min read·Aug 9, 2021----
Hoda SaifulAnalytical Functions in SQL. Part 3When using analytical functions like RANK, PARTITION_BY etc. , the condition within OVER clause could become very lengthy.2 min read·Jul 4, 2021----
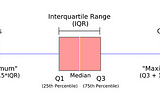
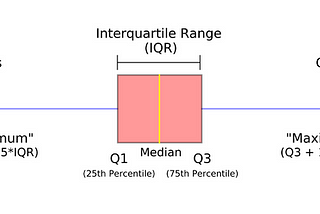
Hoda SaifulBox & Whisker Plots (in Seaborn)Provides 5 critical estimators of any given distribution. Also, referred to as a 5 point summary plot or a Box plot.3 min read·Jul 4, 2021----
Hoda SaifulAnalytical Functions in SQL. Part 2Partition clause restricts an analytic function to within a partition boundary.2 min read·Jul 2, 2021----